Using Spreadsheets to Improve Trading
-
Following a discussion in the Football thread yesterday, I have offered to set up a thread to show how to add information to results trackers to improve analysis and make trading decisions easier.
I don't pretend to be an expert in spreadsheets by any stretch of imagination but I spend most of my working week 40+ hours either setting up or analysing microsoft excel.
The best spreadsheets are those that are kept relatively simple. There are also numerous ways to complete the same task within excel. For example for a basic sum of a column, I can think of at least 6 different ways to do this of the top of my head.
As my boss frequently says, he could give all of us the same task, we would all complete in different ways but get to the same answer, its down to what we're comfortable with.
I'm sure others will have completely different ways of me than doing things.
Maintaining accurate records and how we analyse the data is key to improving our success as traders.
MAybe we can eventually have a set of trading templates for respective sports although we will all want different things which could complicate matters.
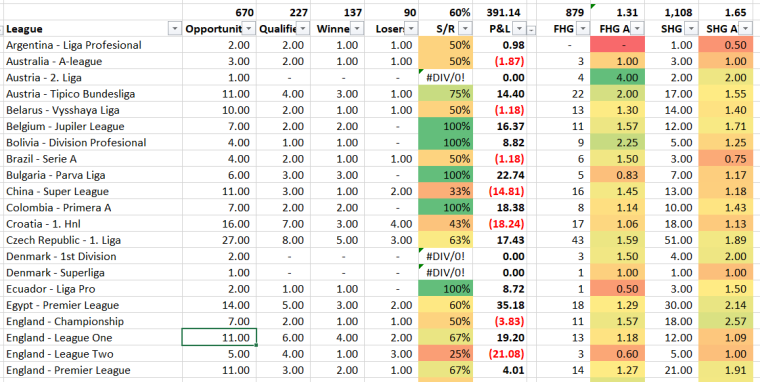
The discussion yesterday was around how can we add analysis of league data to spreadsheets to show the strike rate and/or profitibility of the different leagues and countries which will be what I will put together first with instructions on how to incorporate, an example of what I do is below: -

I realise everyone is at different levels with spreadsheets, some use more than others. I have no doubt that some of the ways I do things could be done in a different and easier way. Hopefully others will be able to add what they do also.
If there are any topics people help with then add to this threasd and we can address these in the future - maybe one area a week/month.
I will be focussed towards microsoft excel, I'm afraid I've never used other packages such as Google Sheets, I would imagine there pretty similar.
The one caveat I would add is that I am incredibly busy at work so won't be able to cover more than one topic a week but am more than happy for others to jump in and post what they do.
-
@daniel-mills thanks time has beaten me at the minute from a work point of view but should be able to look at over next few days,
Your right excel will be a combination of lookups and sumif(s) or at a push pivot tables although there hideous things in my opinion.
-
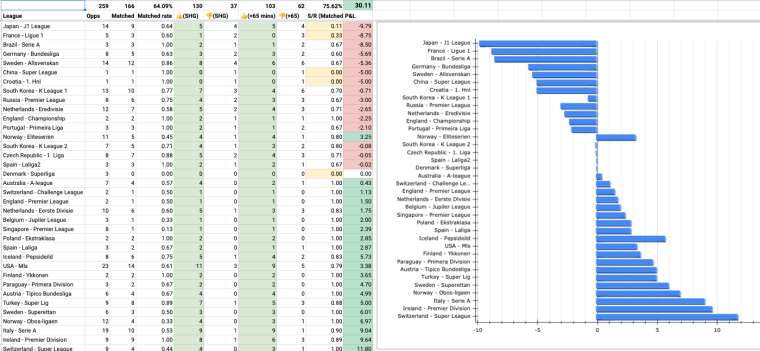
Chris, your post inspired me to recreate the same sort of list within my own stats in google sheets. I don't know if it will be too small if I post but here goes...

I'm using the =FILTER arg(formula/tool/dunno? what to call em) to filter through my results to get real time updates on individual leagues. I posted in the football thread about the s**t month I'd had, but it's been useful having this to look at the data differently and see trades from a different perspective.
I think the Excel equivalent would be xlookup or vlookup to reference different sheets.
Anyway, just wanted to say thanks and give this thread a bump as it's really useful. Cheers.
-
@chris-osborne Excellent post Chris. As you say there are so many different ways of doing the same thing in Excel. I use Excel quite a lot at work, not quite the 40+ hours that you do though! I also have used Google Sheets and Libre Office on my home laptop. Both of them will do the job but Libre Office has more functionality than Google sheets and is just about on a par with Excel plus it's free as well.
From the sounds of it a lot of people on here are at differently levels of expertise with spreadsheets so thought I would add a comment on something I do on my sheets which might be of interest to some. Apologies in advance if it's not.
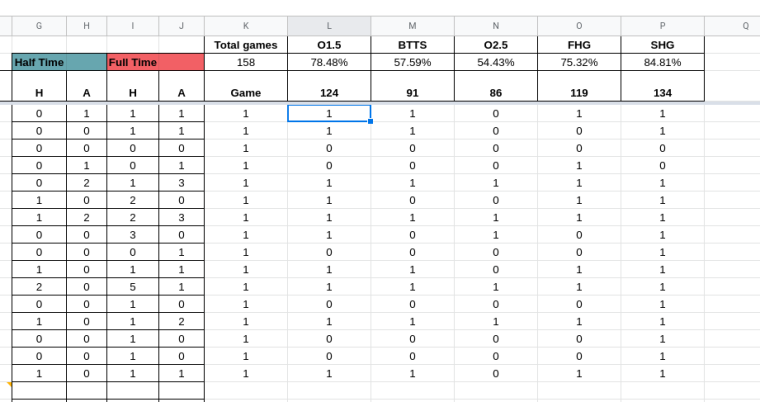
I like to automate stuff as much as possible so on my sheets if for example I'm tracking Over 1.5, Over 2.5 etc then I add formulas to calculate if a game was over 1.5, 2.5, BTTS etc. so all I have to do is to put in the half time and full time scores and the sheet updates the rest. So in the screenshot below everything to the right of column K auto calculates based on the full time scores in columns I & J.
I feel it just makes life a bit easier and helps avoid any potential fat finger mistakes or crossed eyes from staring at a spreadsheet for too long!
Hope this is of use to some.

-
@chris-osborne Cometh the hour, cometh the man!


